7 Risk Assessment Process Techniques That Improve Critical Risk Management in 2026

The risk assessment process involves three phases: Risk Identification, Risk Analysis, and Risk Evaluation. Each phase plays a critical role in spotting hazards and understanding how they affect your operations and prioritizing action. But many organizations struggle to move from identifying risks to managing them.
We've compiled seven risk assessment techniques that strengthen critical risk management in high-risk industries. These methods provide structured approaches to identify and control risks that could affect your workforce and operations, from Bowtie Analysis to Quantitative Risk Assessment.
Bowtie Risk Assessment Analysis
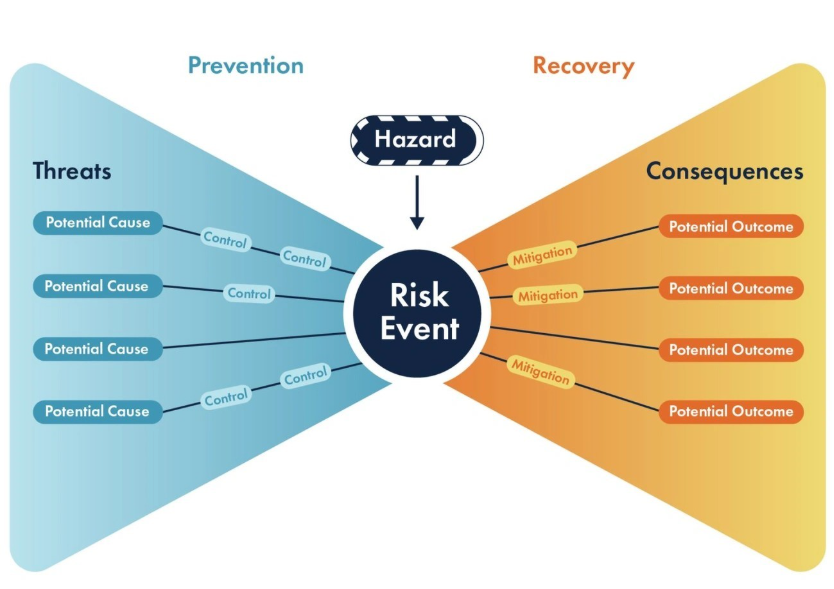
Image Source: Riskonnect
Bowtie Risk Assessment Analysis
What Bowtie Analysis Is and How It Works
Bowtie analysis originated in Australia during the 1970s at the University of Queensland [1]. The methodology gained traction in the oil and gas industry, particularly after the catastrophic Piper Alpha incident in 1988, which resulted in the death of 167 people [2]. This visual risk assessment tool provides a detailed overview of potential hazards, their causes, consequences, and the controls in place to prevent or alleviate them [3].
The diagram earns its name from its distinctive bowtie shape. The "top event" or "unwanted event" sits at the center and represents the moment when control over a hazard is lost [4]. This marks the point where the lion is out of the cage, but damage hasn't occurred yet [1].
The bowtie structure consists of several distinct components:
- Hazard: The potential source of harm or energy that must be controlled (left of diagram)
- Top Event: The critical moment when control is lost over the hazard (center position)
- Threats/Causes: Factors that could trigger the top event (left side of diagram)
- Preventive Controls: Barriers positioned between threats and the top event to stop it from happening
- Consequences: Potential outcomes if the top event occurs (right side of diagram)
- Recovery Controls: Barriers that alleviate impact after the top event has occurred
- Escalation Factors: Conditions that could defeat or reduce control effectiveness [4]
The risk assessment technique follows a timeline from left to right [1]. Each pathway through the bowtie represents a different potential incident scenario. This includes scenarios that haven't occurred yet and makes it a proactive approach to risk management [3].
Why Bowtie Analysis Improves Critical Risk Management
The visual nature of bowtie diagrams delivers multiple benefits for critical risk management. The method provides clear, easy-to-understand visual representation of risk scenarios and makes complex information available to both specialists and non-specialists [3]. My 14 and 16-year-old children know how to create bowtie diagrams. This demonstrates how intuitive this risk assessment tool truly is [1].
Bowtie analysis offers a detailed risk overview by presenting multiple plausible scenarios in a single picture [3]. You see one diagram showing how threats, controls, and consequences interconnect instead of pages of risk matrices [3]. This approach helps organizations identify potential weaknesses in their risk management processes and spot gaps in control frameworks [5].
The methodology clearly identifies preventive and mitigative measures and drives accountability [3]. It supports proactive risk-based decision-making and helps organizations allocate resources to reduce critical risks effectively [3]. The detailed risk information generated enables strategic decisions and ensures proper resource distribution [6].
Bowtie analysis originated in oil and gas but has been adopted across aviation, mining, maritime, chemical, financial services, and healthcare sectors [3]. Its versatility allows application not only to safety risks but also to environmental, financial, reputational, and operational risks [3].
How to Implement Bowtie Analysis in Your Organization
Start by identifying major accident hazards through Process Hazard Analysis studies such as HAZID, HAZOP, or LOPA [5]. Bowtie risk assessments should focus on high-risk scenario sets that can have major impacts. Note that setting a minimum threshold for major hazards is important, such as any hazard that could result in loss of life [2]. A good starting point involves creating bowties for 5 to 10 hazards [3].
Organizations develop bowtie analyzes by organizing multidisciplinary workshops where participants cooperate to identify potential threats, consequences, and control measures [3]. Facilitators prepopulate draft bowtie diagrams with findings from previous risk assessments before the workshop [5]. Different stakeholders then contribute their expertise during the workshop to identify additional threats, consequences, and barriers [5].
After establishing the hazard and top event, list potential causes on the left side and possible impacts on the right [7]. Categorize control measures as preventive (before the top event) or mitigative (after the top event) to evaluate them [7]. Assess barrier quality by ensuring all barriers are well-designed, properly installed, and maintained consistently [7].
GRC platforms can automate bowtie generation by leveraging API integrations and data aggregation to pull relevant risk information from incident management systems, risk registers, and control frameworks [3]. The software maps relationships between risks, causes, consequences, and controls and enables up-to-the-minute updates [3].
Regular review of your bowtie risk assessments is critical to successful implementation. Verify whether barriers remain effective and whether new threats have emerged [7]. Operations and maintenance teams interact with controls and ensure their validity, so controls must be integrated within these functions [2]. On top of that, linking controls to assets in maintenance management systems strengthens the overall risk management process [2].
Risk Matrix Assessment Technique
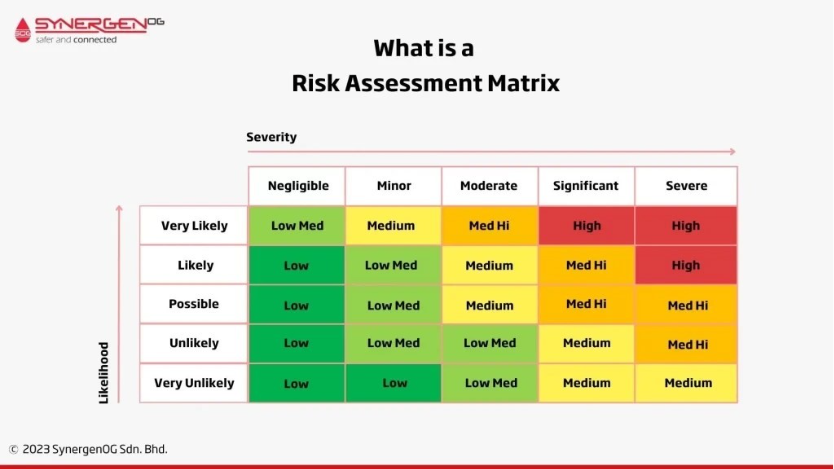
Image Source: SynergenOG
What Risk Matrix Assessment Is and How It Works
A risk matrix maps risks on a two-dimensional scale using likelihood versus impact, often displayed as a 3x3, 4x4, or 5x5 grid [3]. This visual risk assessment tool plots the probability of a risk occurring along one axis and the severity of consequences along the other axis [3]. Each cell in the matrix represents a specific risk scenario and receives a risk rating based on where likelihood and impact intersect [5].
The structure follows a consistent pattern across organizations. One axis ranges from "rare" to "almost certain" for likelihood assessment [5]. The other axis spans from "insignificant" to "severe" when evaluating potential impact [5]. A color-coded system boosts visual clarity: green indicates low-priority risks, yellow or orange signals medium risks, and red emphasizes urgent threats that need immediate attention [3].
Risk scoring applies a straightforward formula: Risk Level = Impact x Probability [8]. To name just one example, probability and impact each receive numeric values from 1 to 5 in a 5x5 matrix [5]. A risk with high impact but low likelihood might score differently than frequent low-impact risks, yet both scenarios need attention through different management strategies [3].
The 5x5 risk matrix is the most common version and provides five rating levels for each component. This allows more accurate analysis than simpler 3x3 grids [5]. Organizations often set thresholds for mandatory escalation; any risk scoring above 16 must undergo review by the risk committee or executive team [3].
Why Risk Matrix Improves Critical Risk Management
Risk matrices present complex data on multiple threats in a simplified visual format [9]. This visual representation enables quick comparison of risk levels and identification of scenarios that need further thought [5]. Decision-makers can determine which risks demand immediate attention and which can be monitored over time. This makes strategic resource allocation easier [5].
The tool promotes structured evaluation through consistent assessment criteria, clear risk categorization and standardized evaluation processes [3]. It creates a common entry point for risk discussions and increases transparency in how organizations prioritize risks [9]. The methodology applies equally to complex systems like global macro-economy and to specific products, services or processes [9].
Risk matrices help organizations identify critical differences between risk types, specifically safety versus environmental risks [5]. They support proactive decision-making by focusing teams on highest-priority risks during workshops [3]. The visual format increases buy-in from workers and helps keep participants on track during risk assessment sessions [3].
But the tool has limitations. Categorizing severity cannot be made objectively for uncertain consequences [3]. Assessment of likelihood and consequence needs subjective interpretation, meaning different users may get opposite ratings of the same quantitative risks [3]. The matrices can mistakenly assign higher qualitative ratings to quantitatively smaller risks [3]. Organizations that address these weaknesses through robust likelihood and consequence definitions can use risk matrices to support quality decision-making [3].
How to Implement Risk Matrix in Your Organization
Begin by identifying the full scope of potential risks across strategic, operational, financial and external categories [5]. Conduct internal analysis while researching external threats through cross-departmental communication [8]. This collaboration provides different views and delivers an all-encompassing picture of potential risks [8].
Define your risk criteria before populating the matrix [10]. Set scales for likelihood (probability of occurrence) and impact (potential severity of consequences) [10]. Choose your matrix size based on project complexity: simple projects work well with 3x3 grids, while larger operations benefit from 5x5 matrices that offer more nuanced risk views [5].
Assess each identified risk using your criteria, then plot them on the matrix according to likelihood and impact scores [10]. Organizations should involve stakeholders during evaluation to capture comprehensive risk views rather than rely on generic assessments [3]. The matrix should evolve with changing operations rather than remain static [5].
Update your risk assessment matrix regularly, at minimum annually or when risk appetite changes, new business activities launch, major incidents occur, or regulatory requirements shift [3]. Documenting changes over time supports audit trails and demonstrates compliance with ISO 31000 and COSO ERM frameworks [3].
Failure Modes and Effects Analysis (FMEA)
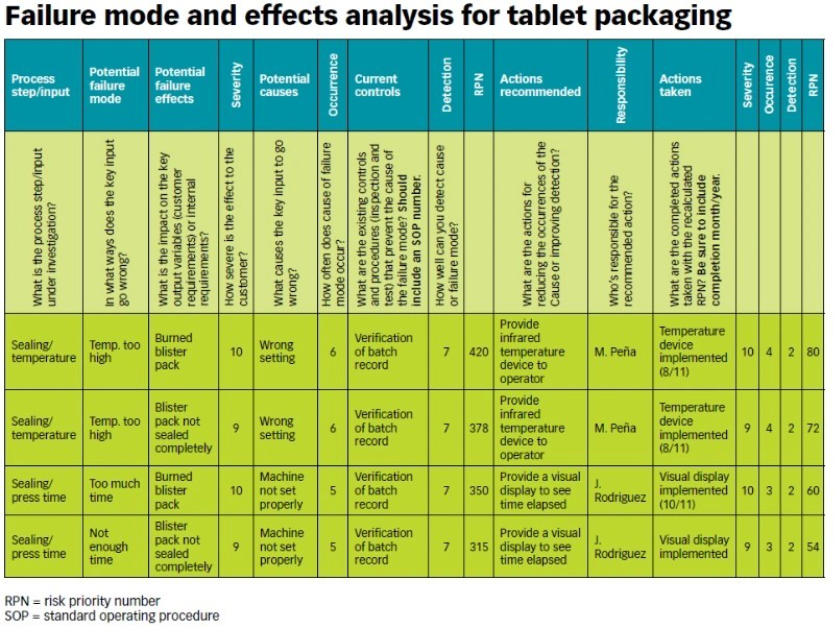
Image Source: ASQ
Failure Modes and Effects Analysis (FMEA)
What FMEA Is and How It Works
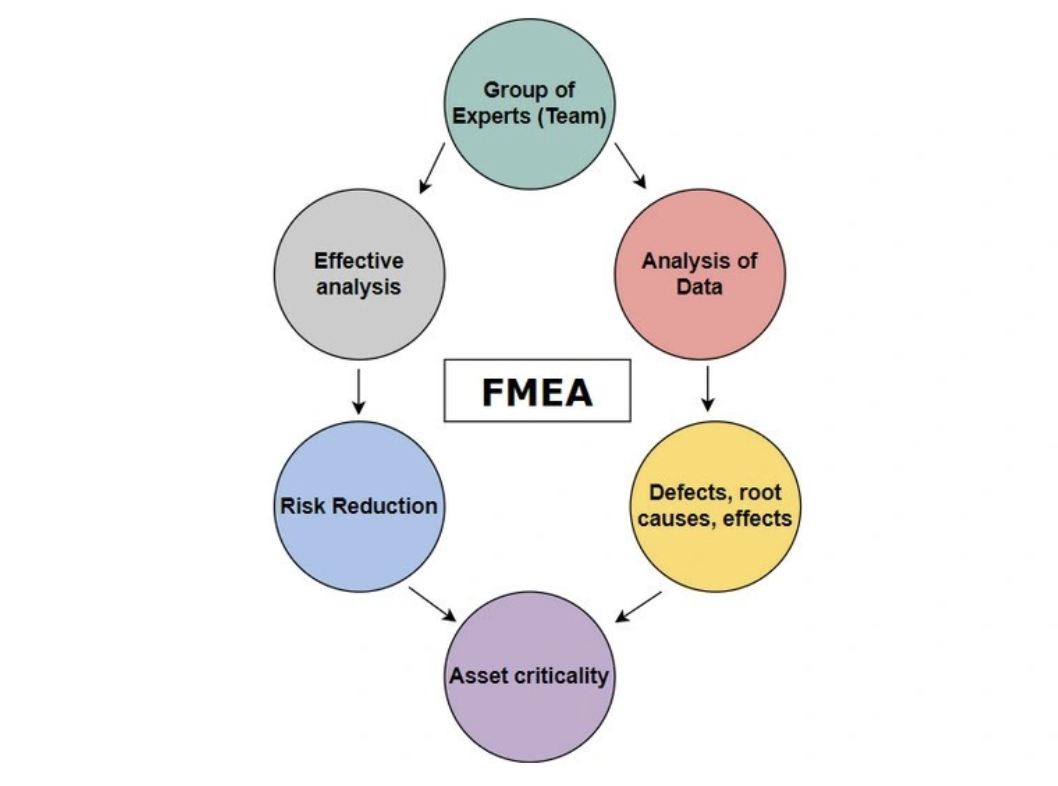
The U.S. military developed Failure Modes and Effects Analysis in the 1940s. It provides a systematic, step-by-step approach to identify and prioritize possible failures in designs, manufacturing processes, products, or services [3]. The methodology asks three fundamental questions: What could go wrong? What would the consequences be? And how likely is it to happen [5]?
"Failure mode" refers to the way, or mode, in which something might fail. These failures represent any errors or defects that affect operations or customers, whether potential or actual [3]. "Effects analysis" involves studying the consequences of those failures and prioritizing them according to severity and frequency [3].
The core of FMEA relies on quantitative risk assessment through three factors: Severity (S) measures the failure's effect, Occurrence (O) reviews the likelihood or frequency of the failure happening, and Detection (D) reviews how well you can detect a failure before it causes issues [10]. These factors combine to produce the Risk Priority Number using the formula: RPN = S × O × D [3].
Each factor receives a rating on a scale from one to 10, where one is insignificant and 10 is catastrophic for severity [3]. The RPN helps prioritize risks, ranging from 1 to 1,000, and suggests where to focus improvement efforts [11]. A manufacturer performing process FMEA on its tablet packaging process identified four potential failure modes with high RPNs that substantially exceeded 125. After implementing corrective actions, all RPNs dropped to acceptable levels below 125 [3].
You can apply FMEA during design to prevent failures (Design FMEA or DFMEA), or for process control (Process FMEA or PFMEA), as well as before and during ongoing operations [3]. The methodology works best when you begin it during the earliest conceptual stages of design and continue throughout the product or service life, since FMEA delivers bigger use and effect when changes are less pricey to implement [3].
Why FMEA Improves Critical Risk Management
The proactive nature of FMEA distinguishes it from reactive approaches. FMEA brings foresight into risk assessment tools instead of relying on hindsight after incidents. This helps reduce operational risks, improve compliance with industry standards, and safeguard customer trust [5]. Organizations gain a well-laid-out pathway to predict risks rather than respond to them after damage occurs.
FMEA supports consistent risk documentation and prioritization of corrective actions while lining up with regulatory requirements [5]. The quantitative scoring system allows decision-makers to focus on the most critical issues first and embeds a proactive risk culture where failures are predicted and prevented [5]. The risk management process helps avoid costs associated with rework, warranties, customer loss, and reputational damage besides enhancing reliability and quality [10].
But the FMEA method has shortfalls. The one-size-fits-all format can be inefficient and lead to ineffectiveness. Lack of return on investment assessment over actions amplifies deficiencies. Lack of data also amplifies problems in many cases and makes the three-dimensional risk assessment difficult and unreliable, which erodes ROI [3]. Even with these challenges, FMEA remains a powerful method to identify and mitigate potential risks in systems, processes, and designs.
How to Implement FMEA in Your Organization
Assemble a multidisciplinary, cross-functional team with diverse knowledge about the process, product, or service, as well as customer needs. The team usually consists of representatives from design, manufacturing, quality, testing, reliability, maintenance, purchasing, sales, marketing, and customer service [3]. Personal knowledge of what happens (not what should happen) proves vital to project success [12].
Define the FMEA scope: Is it for concept, system, design, process, or service? What are the boundaries? Use flowcharts to identify the scope and ensure every team member understands it in detail [3]. Identify the ways failure could happen through brainstorming sessions for each function within your scope. This represents the most critical activity in FMEA [3].
Determine how serious each effect is by assigning severity ratings. Record only the highest severity rating for that failure mode if a failure mode has more than one effect [3]. Calculate the RPN for each identified risk, then develop and implement corrective actions for high-priority failure modes [3]. Reassess RPN rankings to measure effectiveness after implementing corrective actions [3].
FMEA functions as a living document that should exist as long as the process, product, or service is being used [13]. Update the analysis whenever new cycles begin, changes are made to operating conditions or design, new regulations are instituted, or customer feedback suggests problems [9].
Critical Control Verification Process
Image Source: Department of Finance
Critical Control Verification Process
What Critical Control Verification Is and How It Works
Most material unwanted events are associated with failures of known controls rather than because of failures to anticipate risk [8]. This reality changes the focus from identifying controls to proving they function. Critical Control Verification involves checking that key safeguards exist, are in place and in good condition, function as designed, are being used the right way, and are not being bypassed or failing silently [13]. These checks happen on a regular basis.
The methodology relies on proof, not assumption or guesswork [14]. Verification activities include scheduling inspections to verify controls are in place, documenting inspection results, and instigating corrective actions when needed [9]. Organizations might use various terms for verification activities: audit, review, monitoring, and active monitoring [13].
Critical Control Management takes a different approach than traditional risk assessment techniques. Some controls are more important than others [8]. The approach focuses on identifying and prioritizing the small number of controls essential to preventing specific material unwanted events [3] instead of treating all controls as equal. A critical control must function to prevent a fatal or catastrophic outcome. The consequences are severe if that control fails [3].
Verification processes gather information regarding each critical control on behalf of the critical control owner who reports to the material unwanted event owner at a defined frequency [13]. Organizations should design information flow to communicate variances between expected and actual critical control performance in the quickest way, such as with a traffic light reporting system [13]. Performance below defined thresholds should trigger action. This might vary from an investigation to an order to stop relevant work processes right away [13].
Why Control Verification Improves Critical Risk Management
The absence of accidents or incidents must not be taken as evidence that controls are working well enough [13]. Where there is more than one control, a control may fail without any incident occurring on account of redundancy in the controls [13]. The verification process becomes vital to detect controls not performing according to specified requirements as a result [13].
Controls can degrade without regular verification. This increases the likelihood of undetected failures where controls may be non-functional without operators realizing [5]. Organizations face regulatory non-compliance that can result in fines, shutdowns, or loss of license to operate besides operational safety concerns [5]. Verification builds defensibility and avoids surprises that get pricey [13].
Control verification is designed to inspect work areas to verify controls are in place, document results, and instigate corrective actions if required [5]. The focus is not to catch people out but to better understand how work is done [5]. An orientation to learning proves critical so that focus remains on continuous improvement and improved safety outcomes [5].
Organizations can demonstrate adherence to regulatory and industry requirements through systematic verification [5]. The practice is required to meet several international regulations and standards: Australia's WHS, UK's COMAH, OSHA's PSM, and ISO 45001 [10].
How to Implement Control Verification in Your Organization
Begin by identifying your critical controls, which represent the few controls that prevent worst-case scenarios [14]. Define what "working" looks like for each control by asking how you would know it's doing its job [14]. Gather evidence through photos, checklists, test records, inspections, and reports. Keep a log that's easy to audit [14].
Set a verification frequency based on control criticality. Some controls need weekly checks while others need monthly or quarterly ones [14]. Organizations should establish KPIs and roll out a formal critical control verification program to ensure leaders comply and complete verifications appropriate to the risk profile of work planned [5]. But leaders need additional support through training or coaching to ensure quality verification conversations [5].
The cultural maturity of an organization will influence the ease and effectiveness of rolling out a critical control assurance approach [5]. Workplaces where helpful attitudes exist towards new safety processes and strong trusting relationships exist between the workforce and leadership will gain greater benefit from the verification process [5].
Establish standardized processes for conducting verifications, including reporting formats and schedules [10]. Promote collaboration between different levels of management and operational teams to arrange priorities, aid timely responses, and ensure all stakeholders are aware of critical control status [10]. Break down the causes when controls show inadequate performance and use information from the investigation to improve the critical control management process on a continuous basis [13].
Quantitative Risk Assessment (QRA)
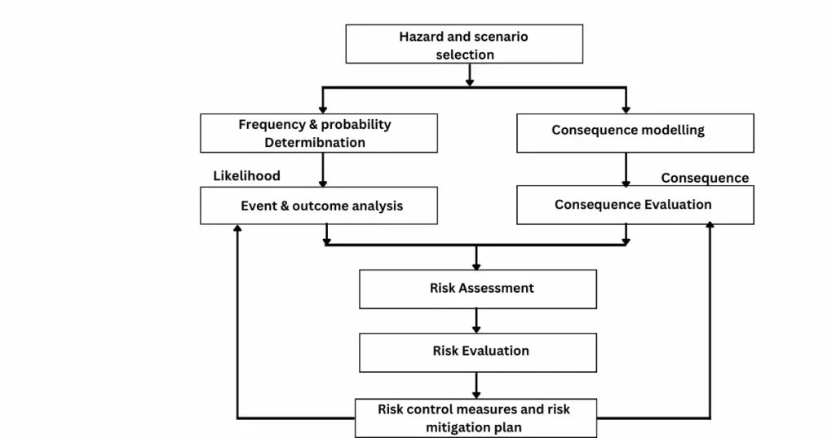
Image Source: iFluids Engineering
Quantitative Risk Assessment (QRA)
What QRA Is and How It Works
QRA is a formal and systematic approach that estimates the likelihood and what it all means for hazardous events. Results are expressed quantitatively as risk to people, the environment, or your business [12]. Qualitative methods categorize risks as "high," "medium," or "low." This risk assessment technique assigns probabilistic values to outcomes and measures probability and impact in financial or measurable terms [15].
The methodology calculates the probability of different accident types and what it all means [16]. Production and processing facilities, high-pressure pipelines, storage and importation sites (including liquefied natural gas or LNG) typically require QRA studies [12].
A typical QRA study follows seven well-laid-out steps [16]:
- Planning: Define the purpose, scope, risk metrics and acceptance criteria
- Information Gathering: Collect detailed facility information, design documents and operational data
- Hazard Identification: Conduct HAZID studies to identify hazards and scenarios, including domino effects
- Frequency Analysis: Determine accident scenario frequencies using historical data, Fault Tree Analysis and event tree analysis
- Consequence Analysis: Assess what it all means, including heat radiation, blast loads and toxic effects
- Risk Integration: Combine frequency and consequence data to calculate overall risk levels and produce risk metrics
- Validation and Review: Confirm assumptions, review results and think about uncertainties through sensitivity analyzes
The outputs include quantitative measures such as Individual Risk contours, societal risk expressed through F-N curves, estimated fatalities, predicted economic losses and predicted environmental impacts [12][16].
Why QRA Improves Critical Risk Management
Many industries must perform QRAs to meet regulatory standards. The Seveso Directive for chemical plants in Europe mandates risk assessment, including domino effects, and third-party risk demonstration [16]. So this regulatory requirement ensures risks are assessed against acceptable risk criteria.
QRA helps organizations design safer processes. Hazards are identified and their impacts assessed, which reduces accident likelihood [16]. QRAs assess various design alternatives during the design phase. Safety gets integrated from the outset and allows cost-effective decisions by analyzing risk and optimizing safety features [16].
The methodology provides informed decision-making in design, operations and emergency planning [16]. QRA also gave an explanation for developing emergency response plans and improving preparedness [16]. Organizations can demonstrate acceptable risk levels during approval of major hazard plant construction plans or at the time of making most important changes to operations, including plant modification or manning levels [12].
QRA highlights accident scenarios that contribute most to overall risk and supports improved decision-making [12]. Teams can focus on these scenarios to meet acceptability criteria and demonstrate that risks are as low as reasonably practicable (ALARP) [12].
How to Implement QRA in Your Organization
An effective QRA capability functions as part of your organization's overall risk management capability [11]. Four attributes prove everything in successful implementation [11]:
Culture requires demonstrable and visible top-down commitment to risk management. Leadership must provide the support needed so high-quality inputs can be gathered from teams for meaningful QRA [11]. Risk management will not work if led only by the Project Controls team. Leadership must show the organization that risk management matters [11].
Process involves well-established procedures for implementing effective QRA. Does your organization employ a formal close-out process to capture and share relevant risk data consistently? Is data available from across the enterprise used to corroborate subjective uncertainty ranges [11]?
Experience centers on your team's meaningful, credible risk management background. Teams properly certified or trained through AACE, RICS or PMI risk professional certification deliver better results [11].
Application focuses on consistency. How consistently do teams apply QRA processes? Do you have dedicated resources to conduct QRA, and does their availability support all projects or only those called most critical [11]?
Hazard and Operability Study (HAZOP)
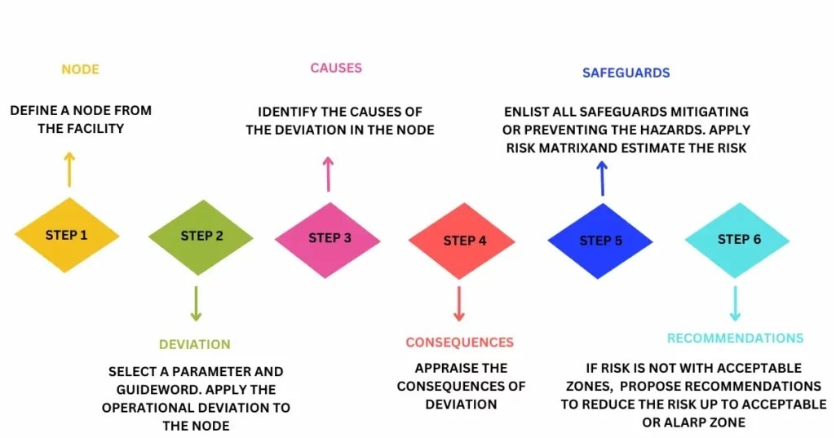
Image Source: iFluids Engineering
What HAZOP Is and How It Works
HAZOP is a structured and systematic examination of complex systems. It identifies hazards to personnel, equipment, or the environment and operability problems affecting efficiency [8]. Imperial Chemical Industries developed the technique in 1960 [9]. The technique breaks overall complex designs into simpler sections called nodes. A multi-disciplinary team reviews these nodes during a series of meetings [8].
The methodology applies standardized guideword prompts to each node. Common guidewords include "no," "more," "less," "reverse," and "other than" [13]. Teams combine these guidewords with process parameters such as flow, temperature, pressure, level, and composition. This helps them explore deviations and potential risks [13]. The team identifies feasible causes and likely results for each deviation. They also check whether existing safeguards are enough [8].
Why HAZOP Improves Critical Risk Management
HAZOP makes proactive hazard identification possible in industries with inherent risks. These include chemical plants, oil and gas facilities, nuclear power plants, and pharmaceutical manufacturing [13]. The structured approach prevents accidents. It identifies situations that could threaten worker safety, damage equipment, or harm the environment before they occur [10].
HAZOP also expresses process inefficiencies, bottlenecks, and equipment vulnerabilities that may lead to downtime [10]. So organizations build systems that are safer, more efficient, and reliable [10].
How to Implement HAZOP in Your Organization
Assemble a team of five to eight people with relevant skills. You need a study leader, recorder, design engineer, operators, and subject matter experts [13] [14]. Define your scope and gather documentation such as P&IDs and operating procedures. Then divide the system into manageable nodes [13].
Schedule meetings with regular breaks. HAZOP studies are mentally demanding [13]. A medium-sized chemical plant with around 1,200 pieces of equipment needs about 40 meetings [8].
Risk Assessment Process Documentation and Review

Image Source: HASpod
What Documentation and Review Is and How It Works
Documentation represents the systematic recording of all potential risks, their assessments, mitigation strategies, and ongoing monitoring activities [17]. This practice captures how organizations operate through policies, procedures, decisions, and responsibilities at its core [18]. The risk assessment process documentation typically has risk registers listing identified risks with their effects and mitigation strategies, incident reports capturing past occurrences, policies outlining frameworks, and audit trails recording changes made during assessments [19].
Records should answer specific questions for each hazard: what the specific hazard is, who might be harmed and how, what controls are in place currently, who maintains these controls, and when the assessment will be reviewed [5]. Version control proves critical by tracking who made which changes and when [20].
Why Documentation Improves Critical Risk Management
Documentation failures remain a leading contributor to adverse events, communication breakdowns, and claims [21]. The adage "if it wasn't documented, it wasn't done" remains a core risk management reality [21]. Proper documentation demonstrates that organizations understand regulatory obligations and provides evidence of compliance, reducing exposure to fines, penalties, and reputational damage [18].
Documentation captures institutional knowledge just as well, ensuring continuity and reducing dependency on specific individuals [18]. Organizations risk repeating mistakes or addressing symptoms rather than why problems happen without reliable documentation [18].
How to Implement Documentation Systems in Your Organization
Organizations should use standardized templates in all business units to ensure consistency in how risks are recorded and assessed [17]. Keep documentation simple and available in formats teams can access and understand when needed [5]. A complex document locked in a manager's office helps nobody [5].
Schedule specific review dates rather than leaving reviews as vague future tasks [5]. The Occupational Safety and Health Administration recommends risk assessments at least once annually, more often in high-risk industries [22]. Review whenever you introduce new equipment, change work processes, hire new staff, or after incidents occur [23].
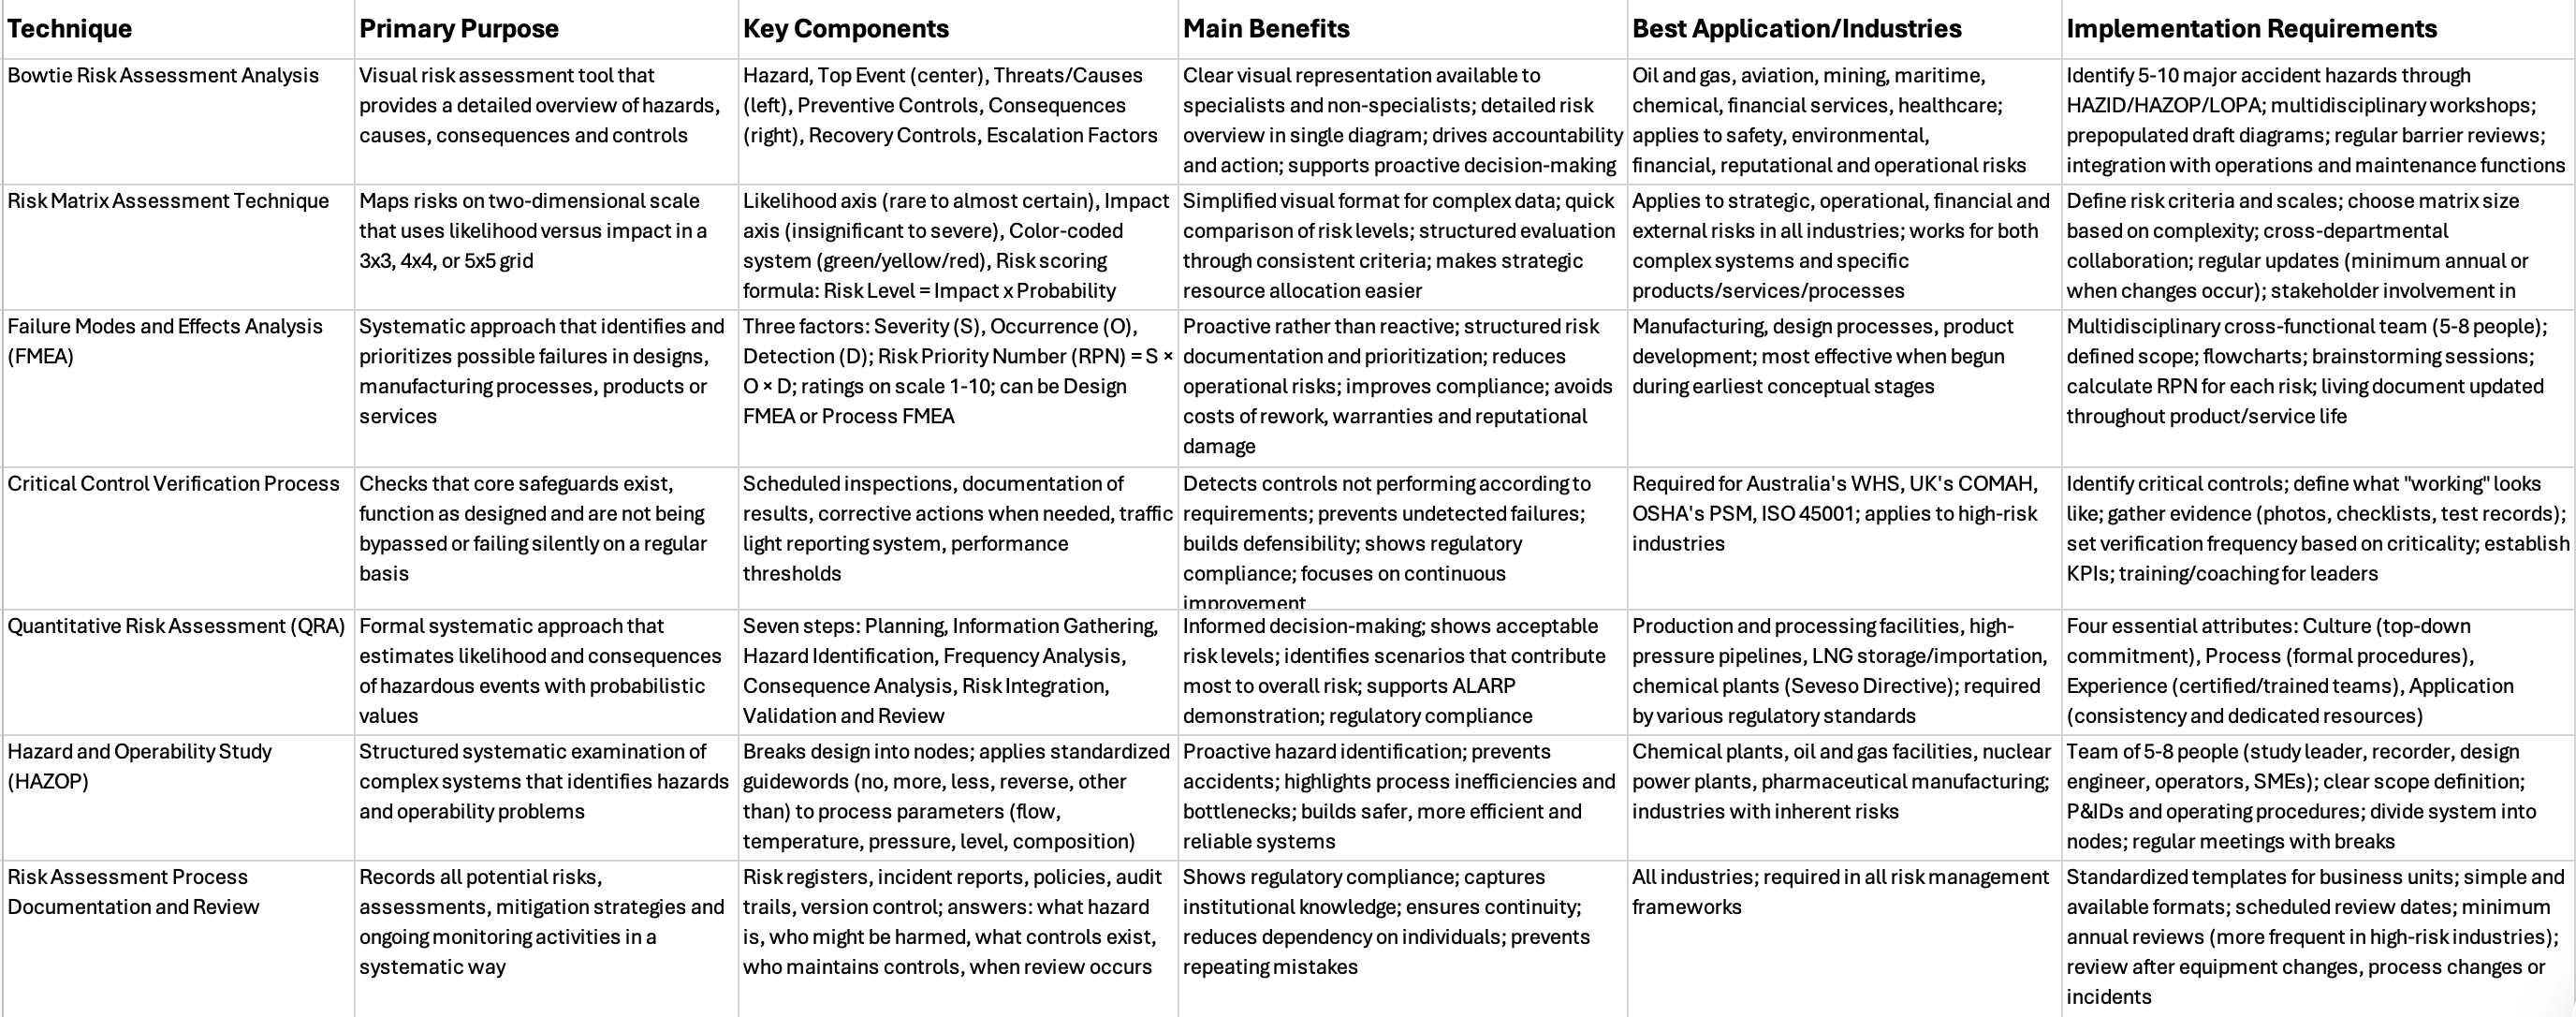
Comparison Table
Comparison Table: 7 Risk Assessment Process Techniques
Conclusion
Not every technique on this list will suit your organization, and that's fine. The key is matching the right method to your specific risk profile and operational needs.
You might find that Bowtie Analysis changes how your teams visualize complex hazards. Another organization may achieve better results with FMEA or QRA. These techniques require commitment, resources, and cultural buy-in from leadership to implement.
Start with one method that addresses your most critical risks. Expand your toolkit as your risk management capability matures. Many organizations combine multiple techniques for detailed coverage.
The goal remains clear: move beyond identifying risks to preventing them.
References
[1] - https://www.protechtgroup.com/en-au/blog/basic-principles-bow-tie-analysis
[3] - https://www.icmm.com/en-gb/our-work/health-and-safety/critical-control-management
[5] - https://nationalcover.com.au/risk-assessment-process-steps/
[6] - https://forwoodsafety.com/building-effective-bowties-for-robust-critical-risk-management/
[7] - https://www.prometheusgroup.com/resources/posts/5-steps-to-create-a-comprehensive-bow-tie-analysis
[8] - https://en.wikipedia.org/wiki/Hazard_and_operability_study
[9] - https://pmc.ncbi.nlm.nih.gov/articles/PMC7246694/
[10] - https://www.sotersoftware.com/post/why-hazops-are-important
[11] - https://www.projectcontrolacademy.com/quantitative-risk-assessment/
[12] - https://www.dnv.com/services/quantitative-risk-assessment-1397/
[13] - https://www.6sigma.us/six-sigma-in-focus/hazard-and-operability-study-hazop/
[15] - https://lumivero.com/resources/blog/quantitative-risk-analysis-101/
[16] - https://www.ors-consulting.com/what-is-quantitative-risk-assessment-qra
[17] - https://www.metricstream.com/learn/risk-documentation.html
[18] - https://www.groupmgmt.com/blog/how-proper-documentation-strengthens-risk-management/
[19] - https://apm-pfq.co.uk/the-importance-of-documentation-in-risk-assessment-processes
[20] - https://www.digitrust.nl/en/articles/how-to-document-risk-assessments/
[22] - https://www.velappity.com/risk-assessment-best-practices/













































.png)









.png)
.png)
.png)
.png)
.png)
.png)
.png)

.png)
.png)
.png)
.png)
.png)
.png)
.png)
.png)
.png)
.png)
.png)
.png)
.png)
.png)
.png)
.png)


Ready to Save Lives at Work?
With Impress Solutions, you’re not just getting a service, you’re securing peace of mind with a partner you can trust. Book a free consultation today, and let’s map out how we can help you save lives at work.

.png)